
API Dashboard
API usage analytics, request trends, and endpoint breakdown.
API Dashboard
The API Keys dashboard provides usage analytics at a glance.
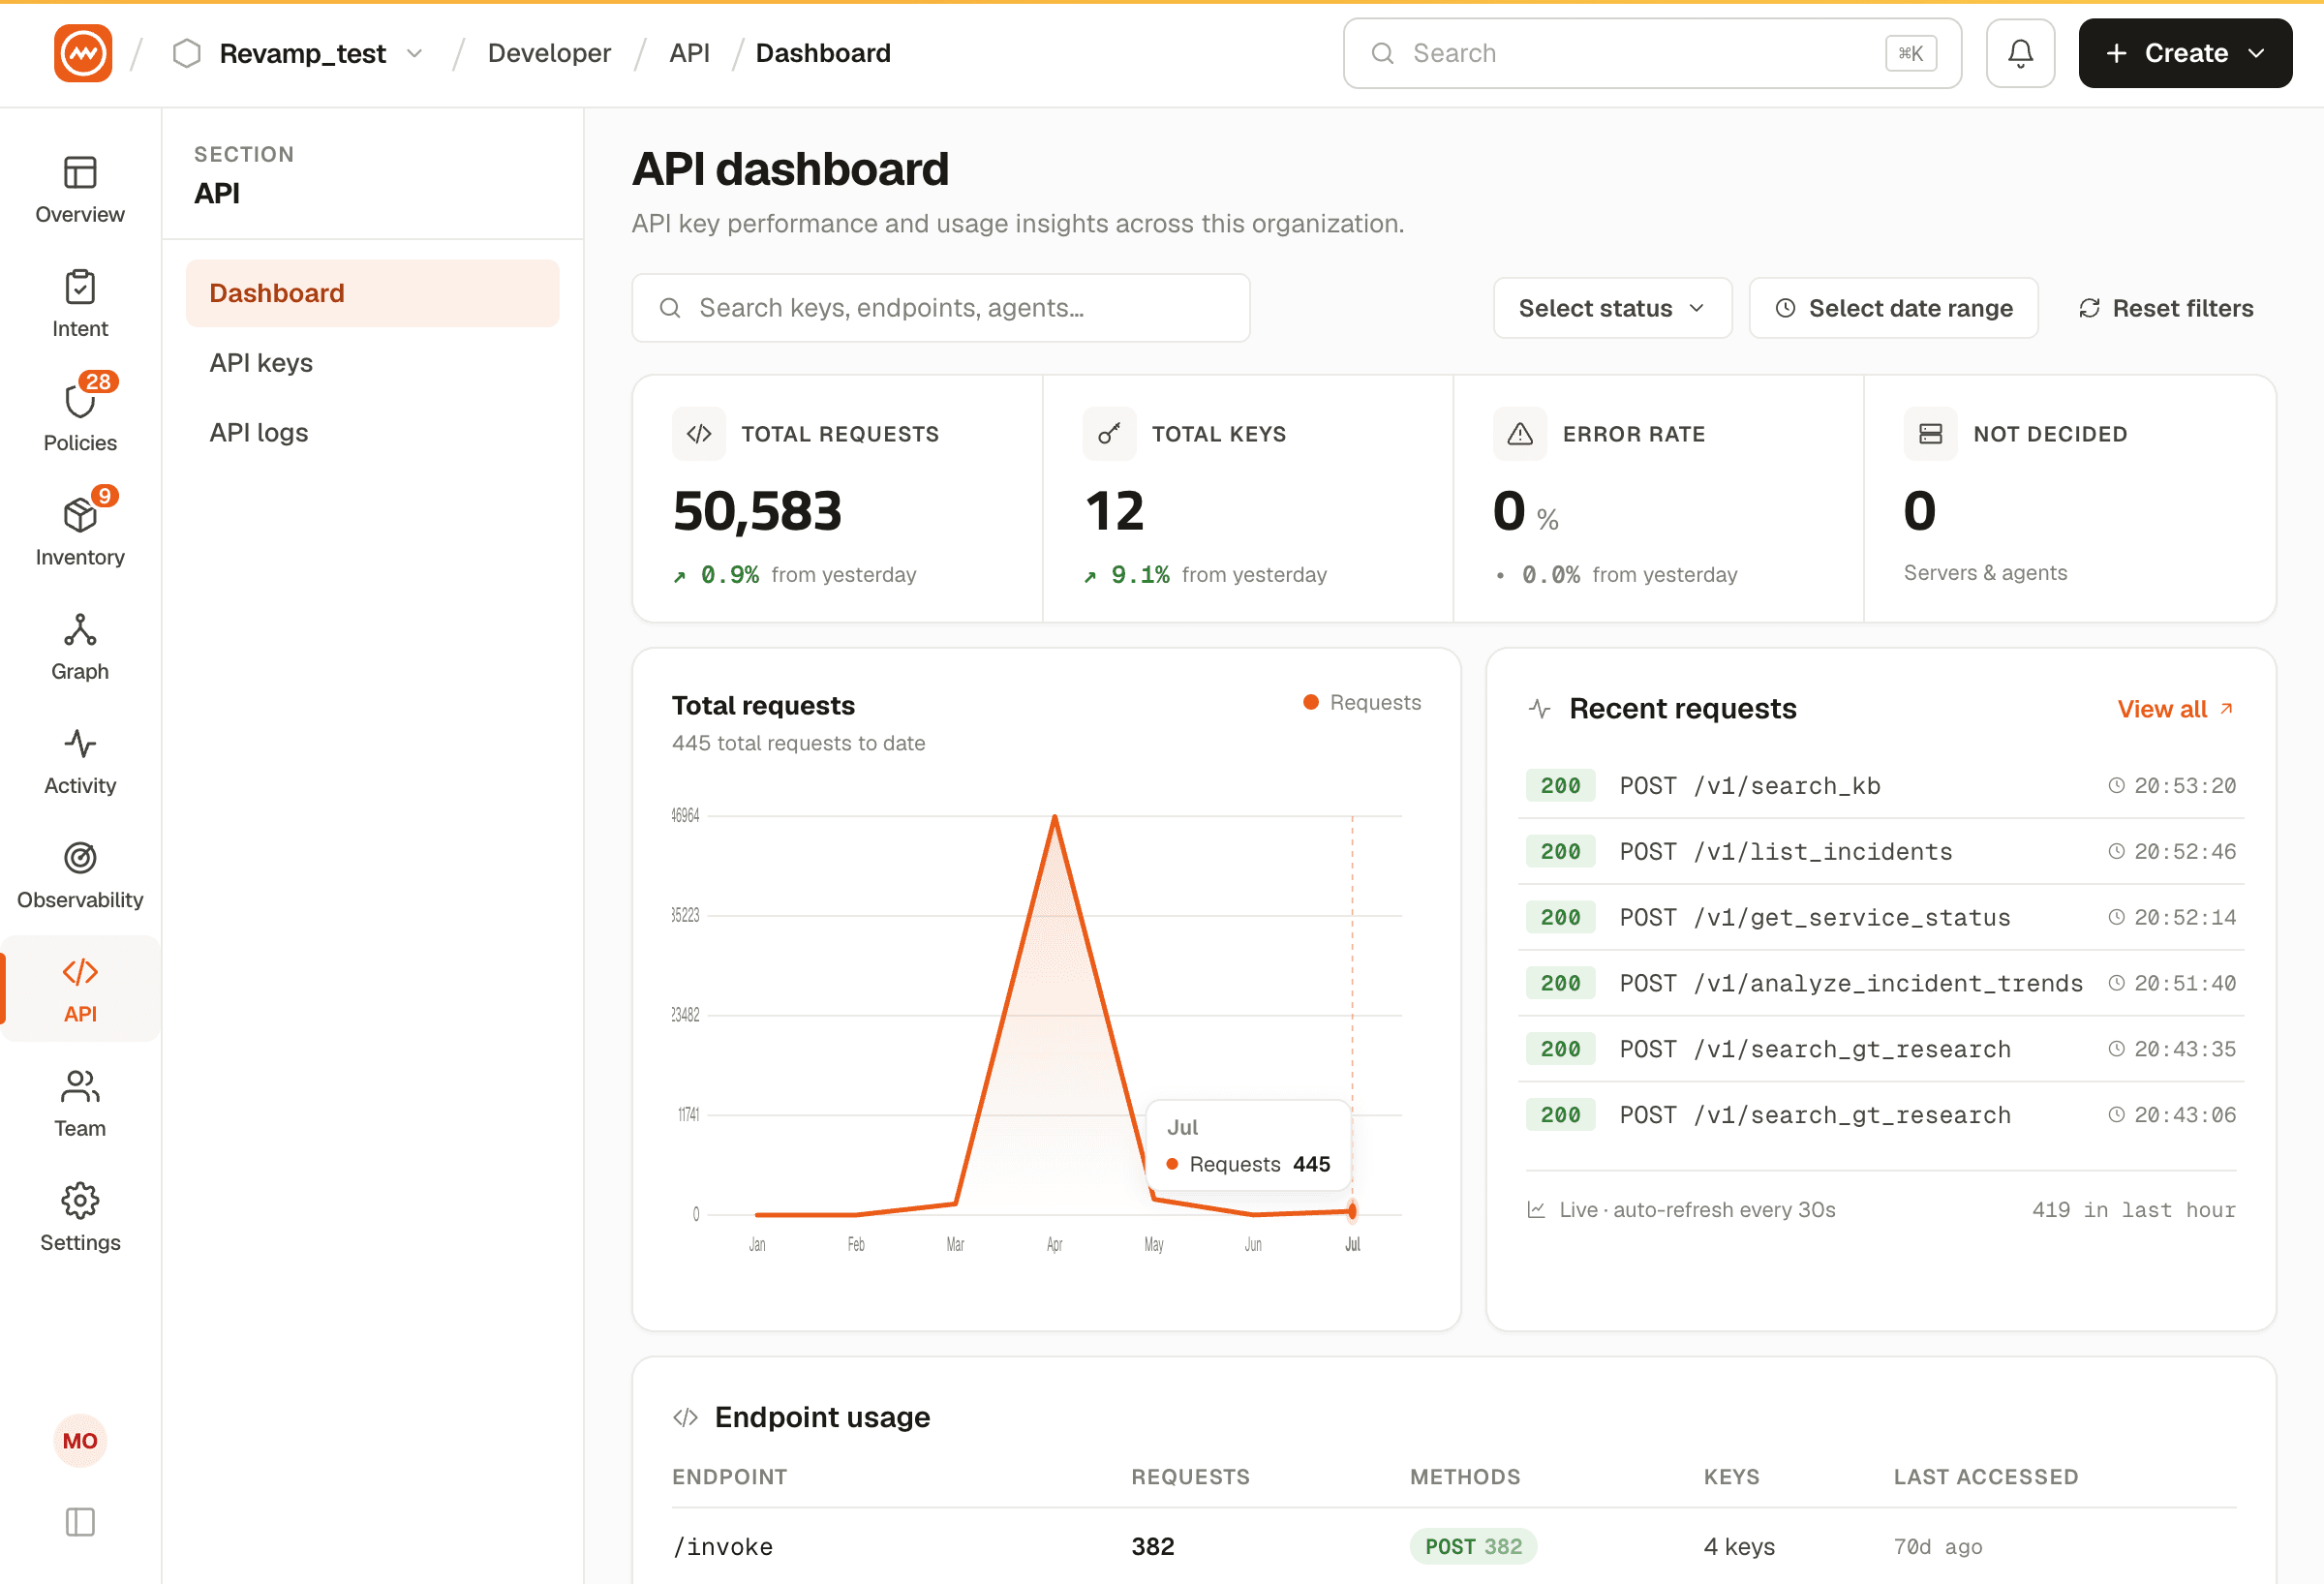
KPI Cards
| Metric | Description |
|---|---|
| Total Requests | Cumulative API calls made with your keys |
| Total Keys | Number of active API keys |
| Error Rate | Percentage of failed requests |
| Servers & Agents | Count of connected resources |
Request Trend Chart
A time-series chart showing API request volume over the selected timeframe.
Endpoint Usage Table
Breakdown of API usage by endpoint:
- Endpoint path
- HTTP method
- Request count
- Last access time