
AIQraph
Interactive graph visualization of your agent-server-tool topology with a live invocation feed and an AI chat panel.
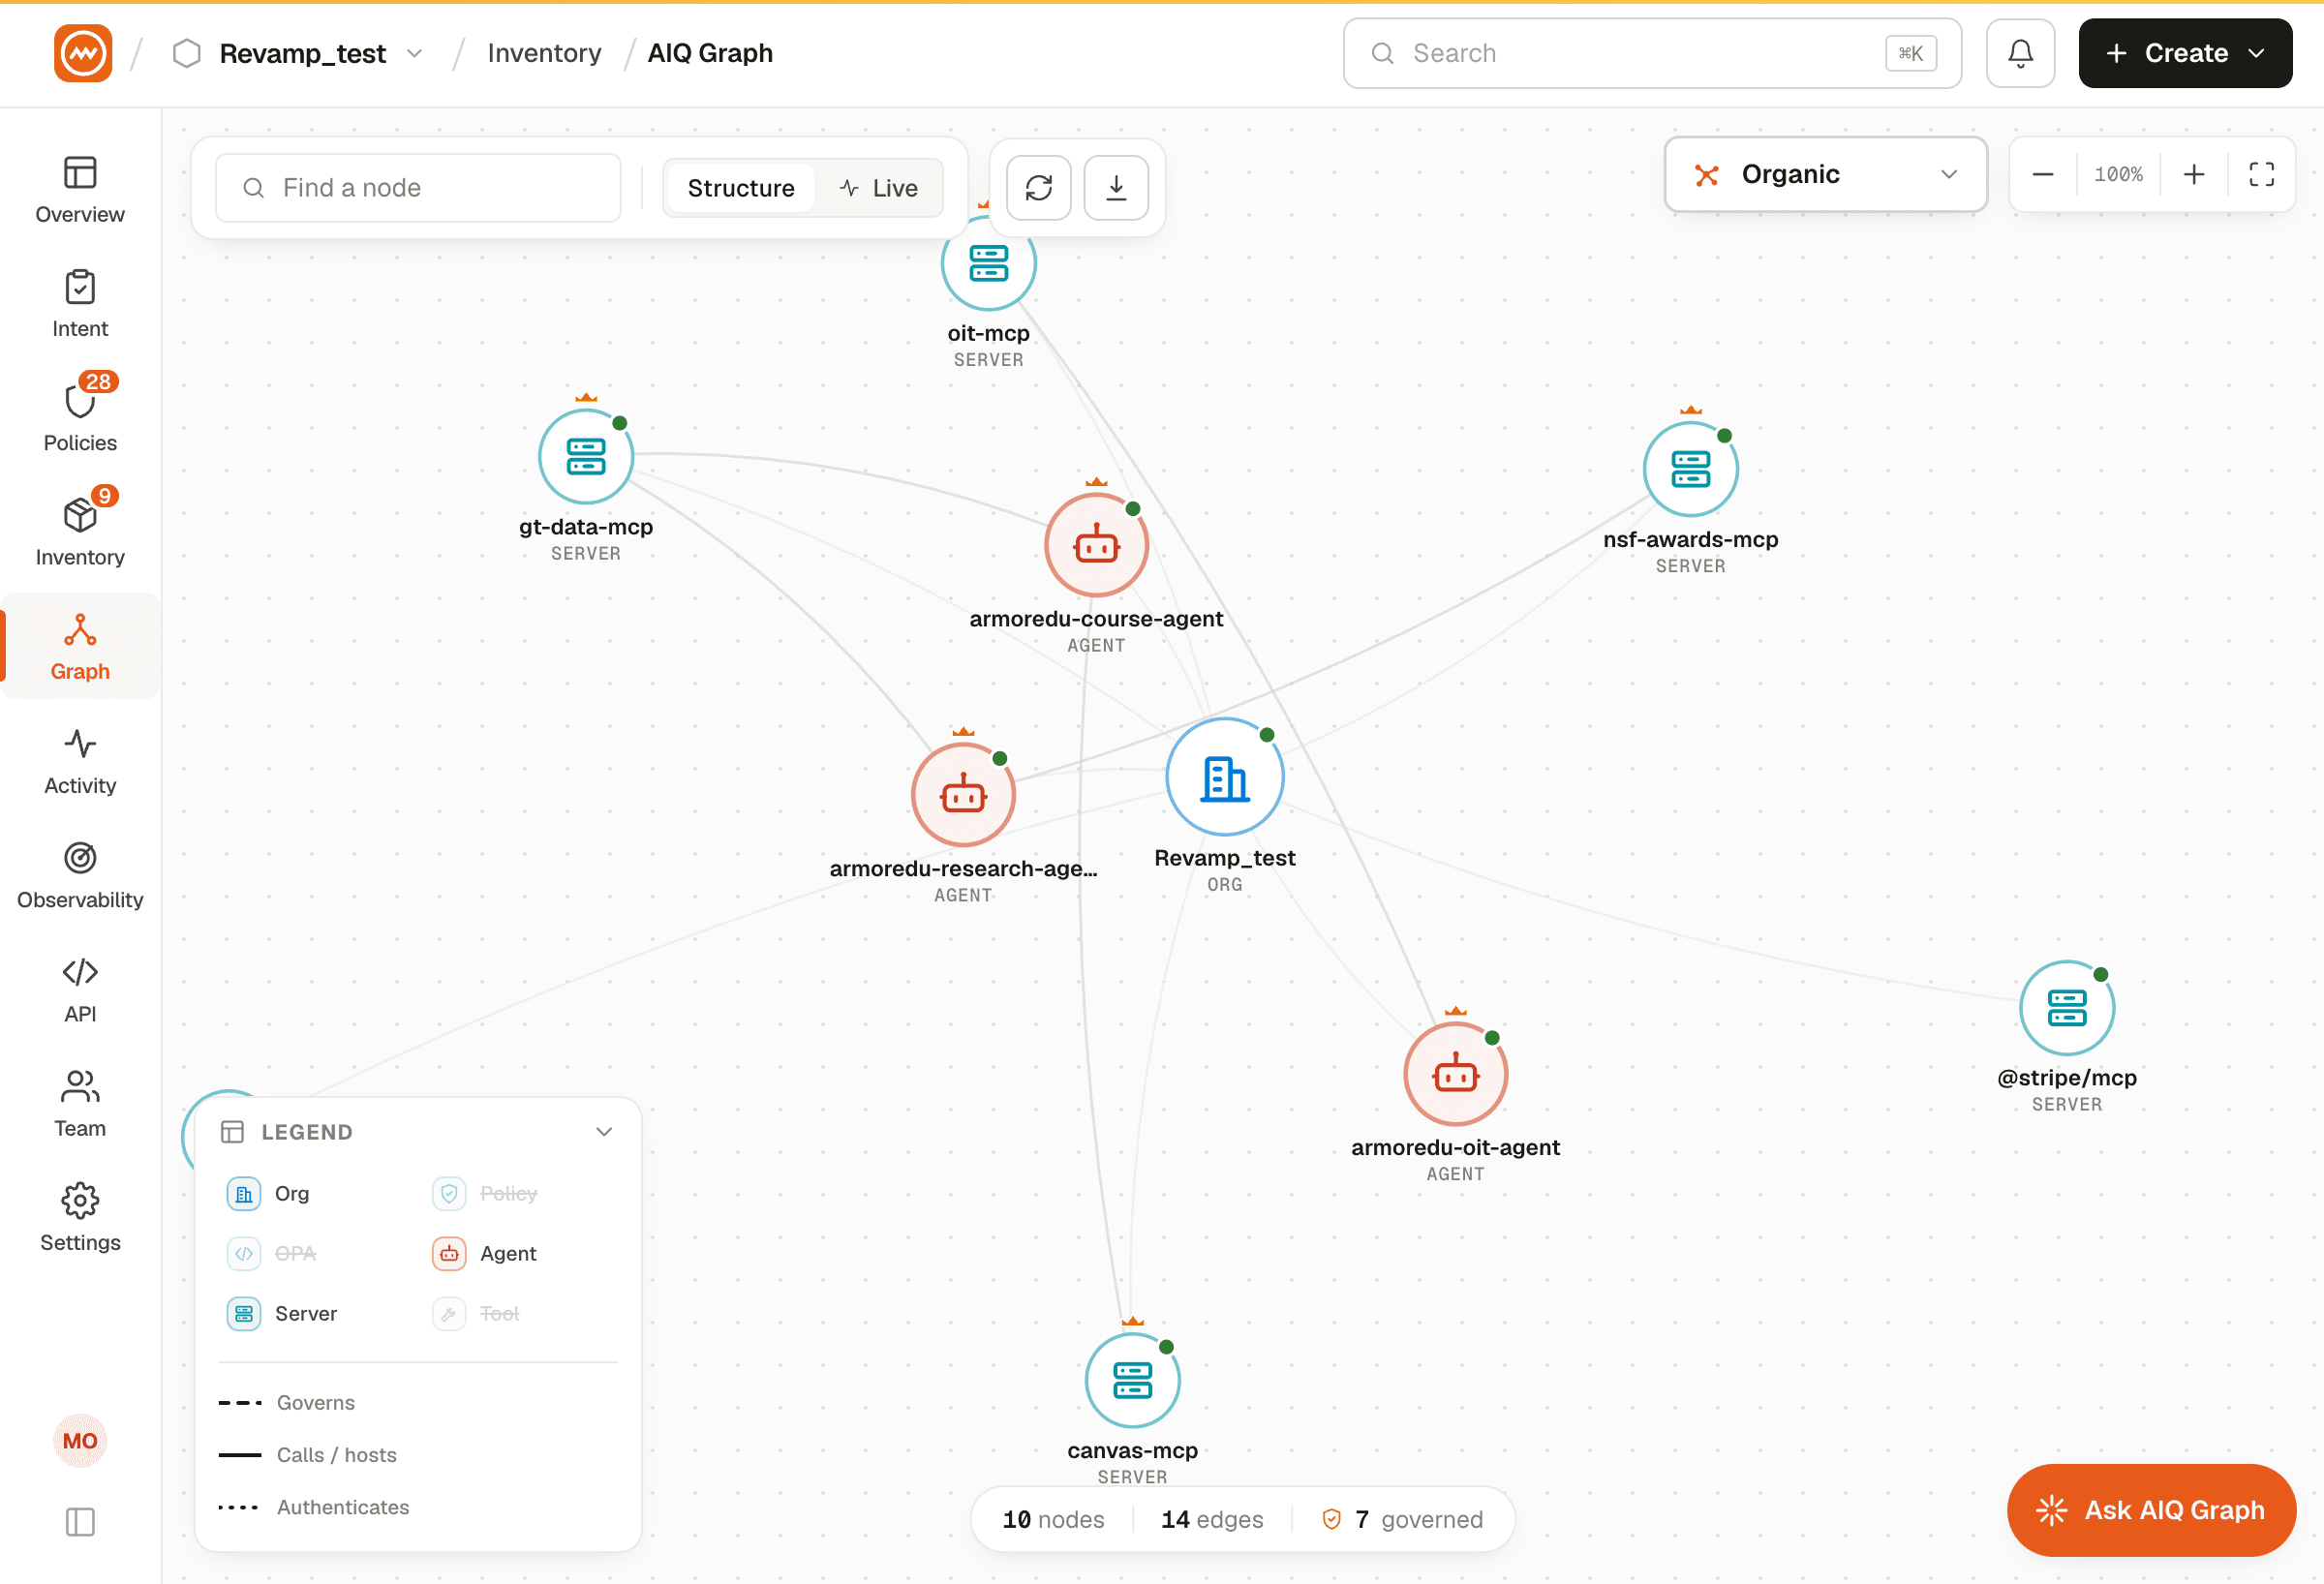
AIQraph is an interactive node-and-edge visualization of your organization's estate - agents, MCP servers, tools, and policies, and how they connect. Navigate to Graph in the sidebar, at /dashboard/graph; the page itself is labeled AIQ Graph.
Graph nodes
The backend's estate endpoint emits these node types, and the graph renders most of them directly:
| Node Type | Description |
|---|---|
| Org | The organization container |
| MCPAgent | Registered AI agents in your organization |
| MCPServer | MCP servers connected to your agents |
| MCPTool | Individual tools exposed by MCP servers |
| Policy / OpaPolicy | Policies applied to agents or servers |
| ApiKey | Emitted by the backend but stripped from the rendered topology |
| IntentPlan | Emitted by the backend but stripped from the rendered topology |
| ToolInvocation | Only rendered in Live mode, as entries in the live feed |
Graph edges
Edge relationships come from the same estate endpoint: owns, hosts, calls, invokes, executes, plans, authenticates, governs, secures, and compiles.
Layout options
The graph is rendered with React Flow, offering eight layouts: Organic, Radial, Hub & Spoke, Structural, Tree, Sequential, Lens, and Grid. Organic layout uses a custom physics simulation rather than d3-force.
Stats bar
The top of the page shows a compact count: total nodes, total edges, and how many of those edges are governed by a policy.
Node detail panel
Click any node to open a detail panel with its risk read, blast-radius stats, an Attach policy action where applicable, and an Ask about this node shortcut into AIQraph chat.
Live mode
Switch to Live mode to see a real-time feed of tool invocations as ToolInvocation nodes, polled on a short interval, with a per-minute call-rate indicator.
AIQraph chat
The built-in chat panel sends questions about your topology to a backend endpoint that builds context from your live graph data and answers with a model. It runs in three modes:
| Chat Mode | Description |
|---|---|
| Hybrid | Combines topology context with open-ended reasoning |
| Context | Answers grounded strictly in the current graph selection |
| Tools | Focuses on tool-level access and invocation questions |
AIQraph reflects live data - registered agents, MCP servers, tools, policies, and (in Live mode) real tool invocations - rather than a static or planned topology.
Use cases
AIQraph helps you visualize which agents can reach which MCP servers and tools, spot connections that aren't covered by a policy, and follow real invocation activity as it happens.