
IAP Dashboard
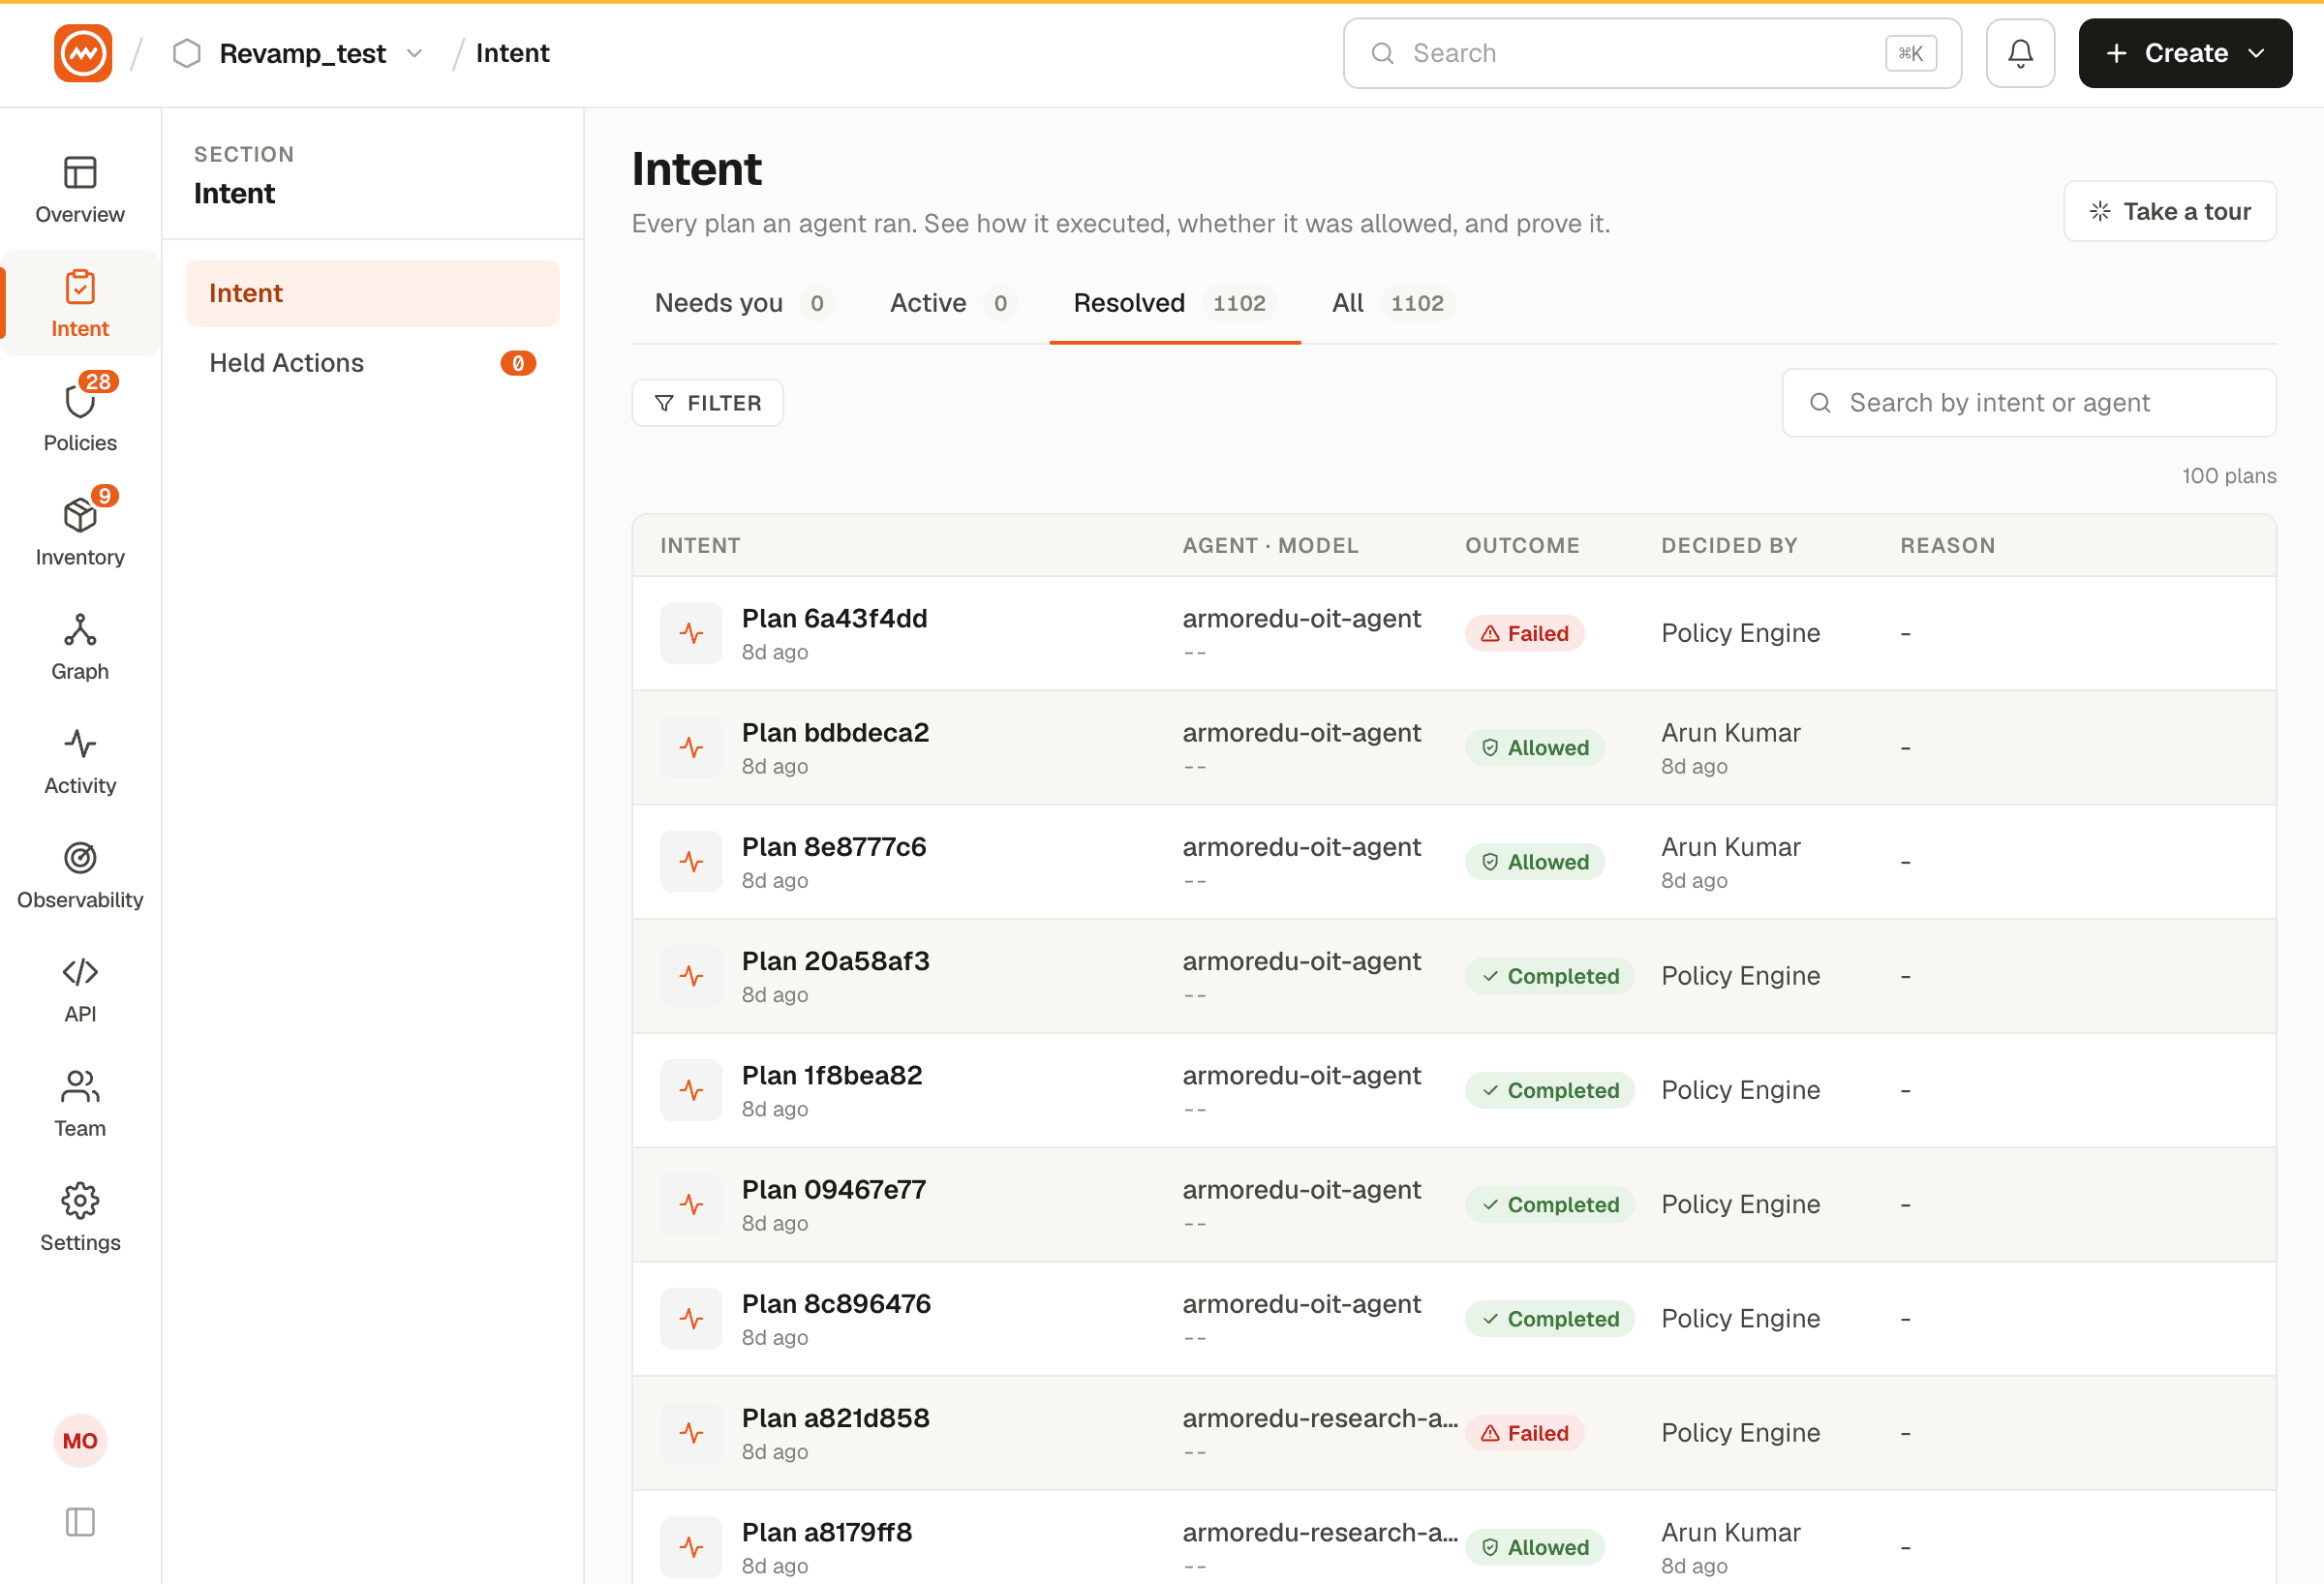
KPI metrics, timeline charts, and active plan monitoring for the Intent Assurance Plan (IAP).
IAP Dashboard
KPI Cards
| Metric | Description |
|---|---|
| Intercepted Today | Number of intent plans processed in the last 24 hours |
| Approved (%) | Percentage of plans that passed all policy checks |
| Blocked (%) | Percentage of plans blocked by policy violations |
| Avg Plan Size | Average number of steps per execution plan |
Timeline Chart
View intent plan activity over configurable time ranges:
- 24 hours - Hourly breakdown of today's activity
- 7 days - Daily trend for the past week
- 30 days - Monthly overview
Active Plans
A live list of currently executing plans with their status, agent, and progress.
Agent Activity
Breakdown of which agents are generating the most intent plans.
Endpoint Usage
Chart showing which MCP server endpoints are being called most frequently.
Policy Violations
Summary of recent policy violations with severity and affected resources.