
AIQraph
Interactive graph visualization of your agent-server-tool topology with live audit streaming and chat-based queries.
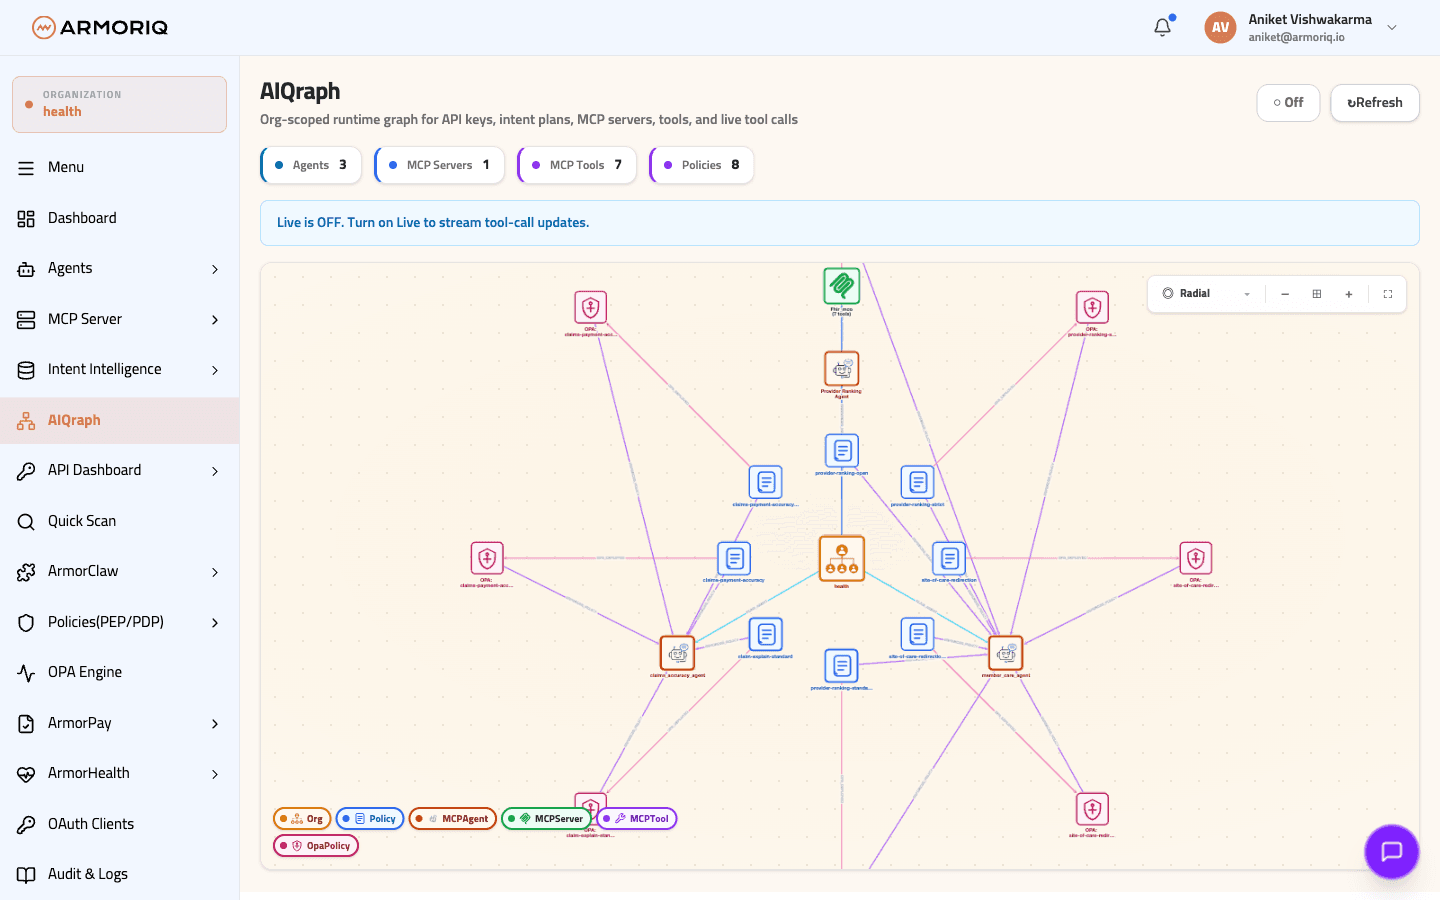
AIQraph provides an interactive network graph that visualizes the relationships between your AI agents, MCP servers, tools, and policies. Navigate to AIQraph in the sidebar or go to /dashboard/aiqraph.
Graph Nodes
The graph displays different node types with distinct icons:
| Node Type | Description |
|---|---|
| Agents | Registered AI agents in your organization |
| MCP Servers | MCP servers connected to your agents |
| Tools | Individual tools exposed by MCP servers |
| Policies | Policies applied to agents or servers |
Graph Edges
Edges represent relationships:
- Agent → MCP Server — An agent is connected to a server
- Agent → Tool — An agent has access to a specific tool
- Policy → Agent/Server — A policy is applied to an agent or server
Stats Dashboard
The top of the page displays real-time counts:
| Metric | Description |
|---|---|
| Agents | Total registered agents |
| Servers | Total MCP servers |
| Tools | Total tools across all servers |
| Policies | Total active policies |
| Plans | Total intent execution plans from IAP |
| Invocations | Total tool invocations tracked |
Live Audit Streaming
AIQraph streams runtime events in real time, showing:
- Tool invocations as they happen
- Enforcement decisions (allow, block, hold)
- Intent plan executions
AIQraph Chat
Use the built-in chat interface to query the graph:
| Chat Mode | Description |
|---|---|
| Query | Ask questions about your topology (e.g., "Which agents use the payments tool?") |
| Trace | Trace a specific invocation path through the graph |
| Explain | Get an explanation of a node or edge relationship |